Usage Tracking
Track your resource usage and costs in real-time.
Overview
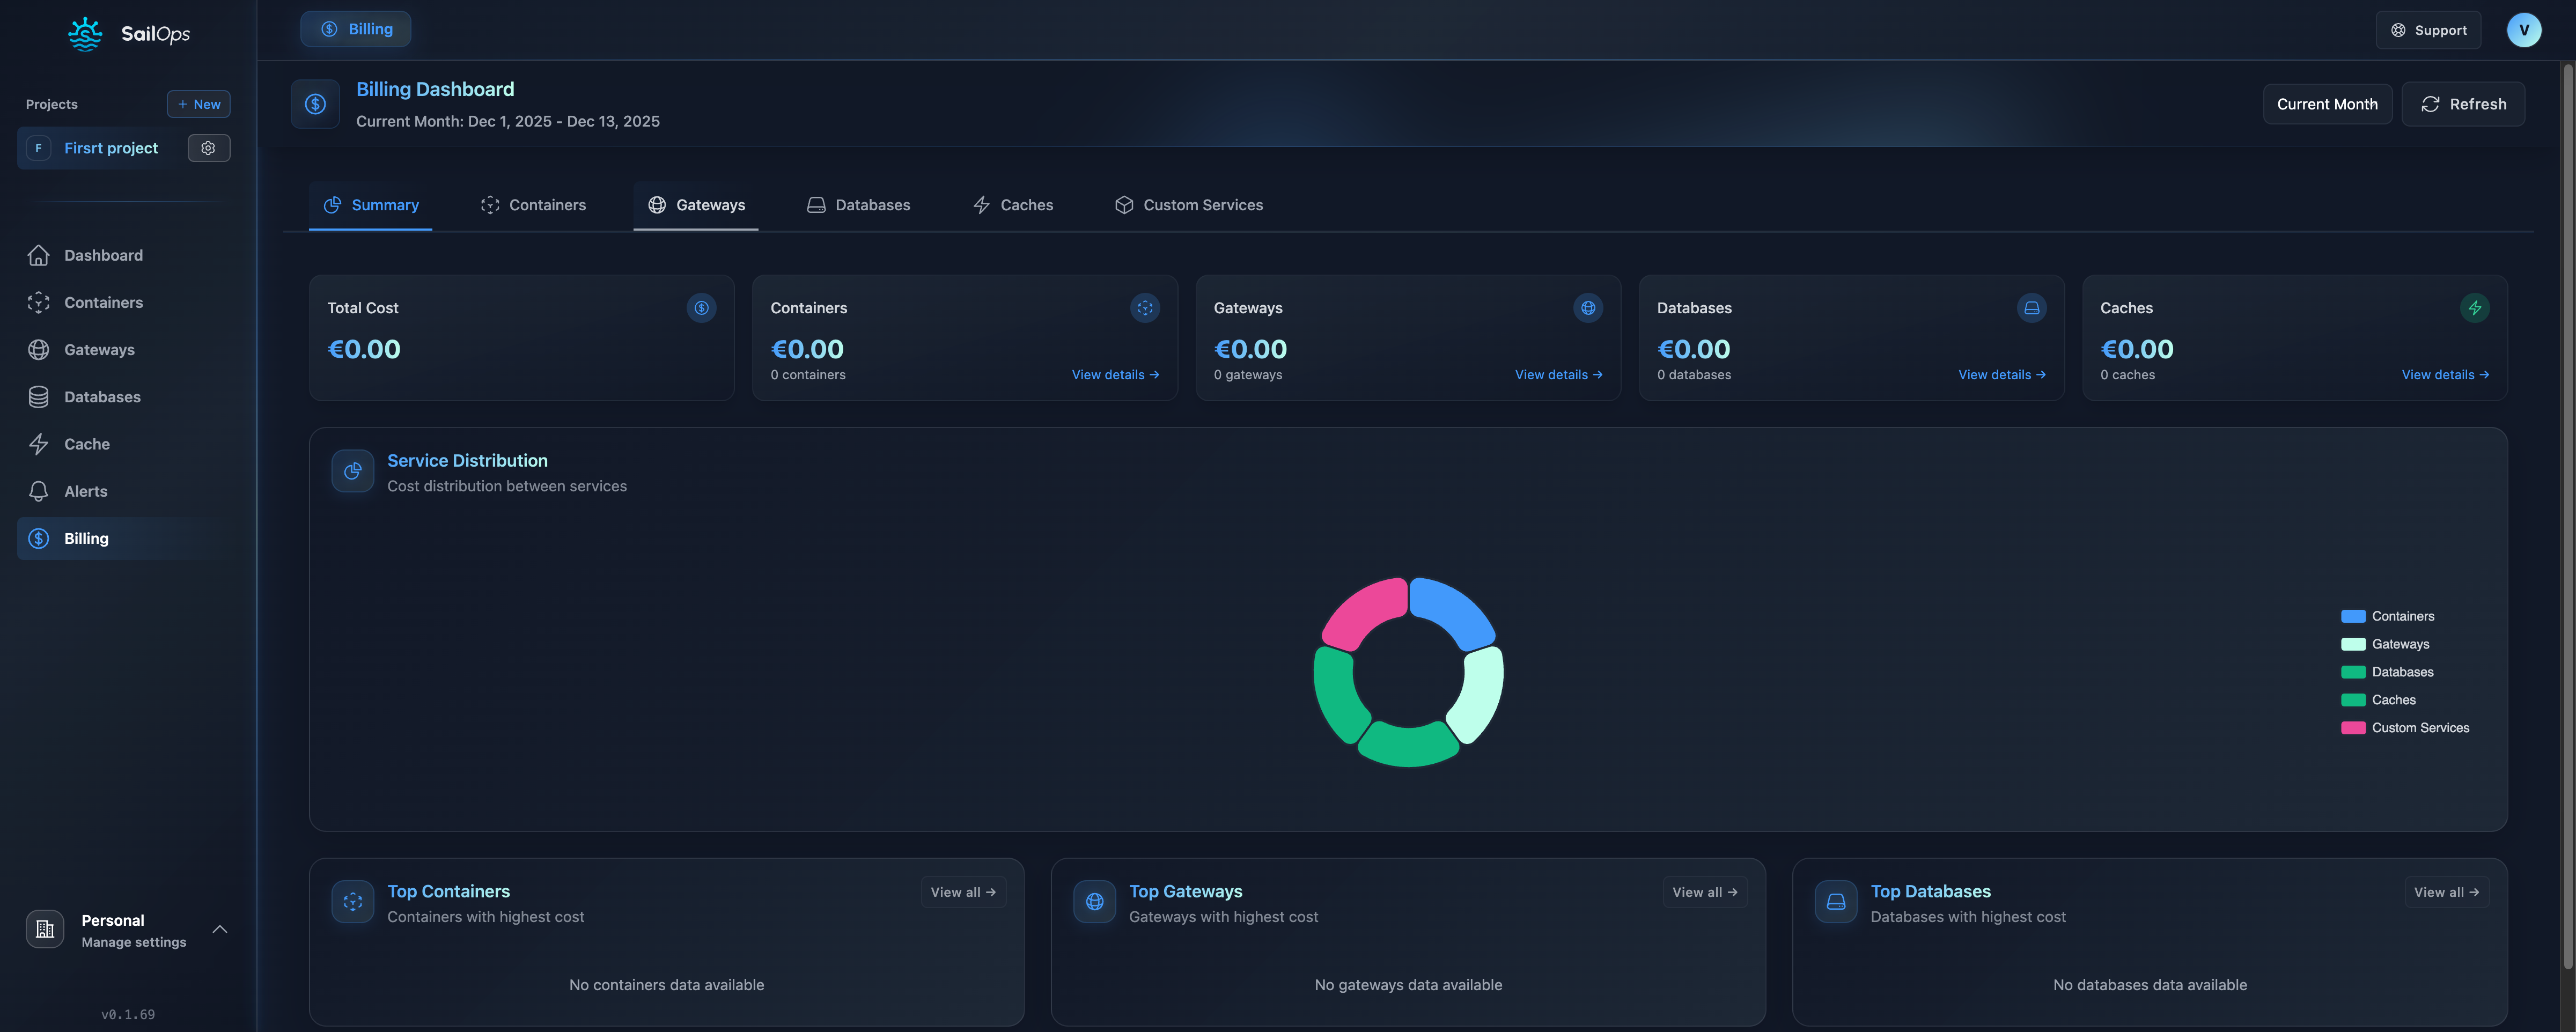
SailOps provides real-time usage tracking:
- Real-time metrics - Current usage and costs
- Per-resource breakdown - Costs for each container, database, etc.
- Historical data - Trends and patterns over time
Viewing Usage
Billing Page
- Click Billing in the left sidebar
- View the Summary tab for an overview
- Select individual resource tabs for details
Billing Tabs
The billing page provides the following resource tabs:
| Tab | Description |
|---|---|
| Summary | Overall cost overview for the billing period |
| Containers | Container compute costs per instance |
| Websites | Website hosting costs (compute + S3 storage) |
| Gateways | Gateway costs by class and usage hours |
| PostgreSQL | PostgreSQL database costs (compute + storage) |
| MariaDB | MariaDB database costs (compute + storage) |
| Caches | Valkey/Redis cache costs |
| NATS | NATS messaging cluster costs |
| Jobs | One-time job execution costs |
| Cron Jobs | Scheduled job execution costs |
| Marketplace | Costs of existing instances deployed before retirement |
| Custom Services | External service costs (daily breakdown) |
| Volumes | Block and shared volume storage costs |
| Object Storage | Object Storage usage costs (storage, requests, downloads) |
Applications deployed before Marketplace retirement
The Marketplace catalog, deployment API and application management pages have been retired. Existing applications keep running with their existing data and endpoints. Their compute and storage remain billable, and their usage continues to appear under the Marketplace billing category.
Project suspension and resume still apply to these applications. For application configuration changes, upgrades or removal, contact [email protected].
Cost Metrics
Container Costs
Per container metrics:
| Metric | Description |
|---|---|
| Usage hours | Hours × replicas |
| Total cost | Class rate × resource allocation × hours |
| GPU cost | GPU-fraction-hours × GPU class rate (when applicable) |
Database Costs
| Metric | Description |
|---|---|
| Compute hours | Database uptime |
| Compute cost | Flavor rate × hours |
| Storage cost | Storage size × storage class rate × hours |
| HA cost | Standby replica (if enabled) |
Gateway Costs
| Metric | Description |
|---|---|
| Usage hours | Gateway uptime |
| Total cost | Class rate × hours |
Log Usage
The Log Usage tab (available in the organization Billing section) shows your log storage consumption:
| Metric | Description |
|---|---|
| Current usage | Total log storage used across all projects |
| Included quota | Log storage included in your plan |
| Overage | Extra storage above the included quota |
| Estimated cost | Projected overage cost for the current period |
Backup Usage
The Backup Usage tab (available in the organization Billing section) shows your backup storage consumption:
| Metric | Description |
|---|---|
| Current usage | Total backup storage used across all projects |
| Hourly usage | Backup storage trend over time |
| Per-project breakdown | Storage consumption by project |
| Estimated cost | Projected backup storage cost |
Observability Usage
The Summary tab on the project billing page includes a Managed observability panel showing OpenTelemetry usage attributed to the project for the selected period:
| Metric | Description |
|---|---|
| Metric samples | Number of OTLP metric samples ingested |
| Active series | Average, p95, and max active metric series |
| Trace spans | Number of OTLP trace spans ingested |
| Trace volume | Total ingested trace bytes |
| Storage | Average retained GiB over the period (computed using the plan retention window) |
If the current user has organization-wide Reporter (or higher) permission, the panel also displays the Organization-level charge for managed observability. This charge covers metrics overage, traces overage, and retained storage overage across the entire organization. It is billed at the organization level and is not allocated to any individual project.
Observability usage totals respect plan changes over time. If your organization changed support plans during the billing period, each segment is computed using the quota and retention window that was active at the time.
Costs View
The Costs page provides a unified view of costs across all your projects for a custom date range. It replaces the former per-project billing page and the organization spending tab.
Accessing the costs view
- Click Costs in the left sidebar (organization level)
- Select a date range using the period picker
- Optionally choose Daily or Monthly granularity
Use the Projects filter menu to restrict the view to a specific project.
What it shows
| Section | Description |
|---|---|
| Total | Combined cost across all visible projects and organization-level charges (excl. VAT) |
| vs previous period | Percentage change compared to the same-length period immediately before the selected one |
| Chart panel | Two modes: Over time (stacked area chart by the active grouping dimension, with a separate Plan & overages bar chart on its own month axis) and Ranked (horizontal bar chart listing the highest-spend groups first, including plan and overages alongside resource groups) |
| Breakdown table | Expandable rows with per-bucket amounts and a period total |
| Plan & overages | Plan cost, log storage, backup storage, and managed observability — toggle visibility with the Plan & overages button in the filter bar |
Grouping and filtering
The Group by selector changes the primary dimension of the chart and table:
| Group by | Description |
|---|---|
| Project | One row per project |
| Service type | One row per resource family (Containers, PostgreSQL, etc.) |
| Resource | One row per individual resource |
| Resource type | One row per billing metric (CPU, Memory, Storage, etc.) |
Filter menus let you restrict the view to specific projects, resource families, individual resources, or resource types. Active filters appear as removable chips below the filter bar. Organization-level lines are excluded when a project or resource filter is active; use the Plan & overages toggle to control their visibility explicitly.
Organization-level usage detail
Below the resource costs table, a Plan & overages section shows plan cost, log storage, backup storage, and managed observability in a unified table. Each line lists its months and detail rows — axes for metered lines, or the applied pricing component for the plan — with the following columns:
| Column | Description |
|---|---|
| Month | Calendar month the row belongs to |
| Detail | Axis name (e.g. "Metric samples", "Trace spans") or plan component. A charged tag marks axes that exceeded their allowance. |
| Consumed | Consumption relative to the included allowance (e.g. "60.00 of 50.00 million samples"). Lines with no allowance show the quantity alone. |
| Consumption at catalog price | All units valued at the catalog overage price, including those the plan covers. This is not an amount due. |
| Included in plan | The deduction for the units covered by the plan. Blank when the axis has no allowance. |
| Billed | The amount actually charged and counted toward the total. |
The catalog and included columns appear only when at least one line has an allowance to deduct.
Each line also provides a Usage link to its dedicated organization settings page (observability usage, log usage, or backup usage) where you can see the full quota and ingestion detail.
When viewing a partial calendar month, the table notes whether the allowance shown is prorated to the selected window or stays at full monthly scale, depending on the metric.
Granularity
Granularity is adaptive: periods up to 62 days default to daily buckets, longer periods default to monthly buckets. You can override this with the granularity toggle.
CSV export
Click Export CSV to download a detailed export of the visible data. The export honours the active period, granularity, and filters. Each row represents one resource metric in one bucket, with columns for project, resource type, resource name, class, metric, unit, quantity, unit price, and total.
Use the costs view to compare projects side by side, identify which service types drive the most cost, and drill into individual resources for per-metric detail.
Usage CSV Export
You can download a detailed CSV export from the Costs page by clicking Export CSV. The export honours the active period, granularity, and filters. Each row represents one resource metric in one bucket, with the following columns:
| Column | Description |
|---|---|
| From / To | Bucket boundaries (UTC) |
| Month | Calendar month the bucket belongs to |
| Project | Project name |
| Category | Resource type (Container, PostgreSQL, Gateway, Custom Service, Object Storage, etc.) |
| Name | Resource name |
| Class | Compute or storage class |
| Metric | Resource dimension (CPU, Memory, Storage, GPU, Custom, Gateway, Instances, Object storage, S3 writes and listings, S3 reads and HEAD, S3 downloads) |
| Unit | Billing unit (core-hours, GiB-hours, GPU-hours, hours, GiB-month, requests, GiB) |
| Quantity | Amount consumed |
| Unit Price | Price per unit |
| Total | Line total |
Organization-level charges (plan, log storage overage, backup storage, managed observability) are included as separate rows when no filter is active.
The export is capped at 1 000 000 rows. If the export exceeds this limit, narrow the period, add a filter, or pick a coarser granularity.
Usage Optimization
Identify Waste
Look for:
- Unused resources still running
- Oversized instances with low utilization
- Stopped containers with persistent storage
Right-Size Resources
Monitor actual usage in the Observability tabs of your resources:
If CPU < 30% and Memory < 50% consistently:
  → Consider downgrading compute class or flavor
Troubleshooting
Unexpected Costs
If you see unexpected charges:
- Check for forgotten running resources
- Review autoscaling events
- Check storage growth
- Review all billing tabs for active resources
Missing Usage Data
If data isn't appearing:
- Wait a few minutes (propagation delay)
- Check the resource is running
- Contact support
Cost Discrepancies
If costs don't match expectations:
- Review time zone settings
- Check proration for partial periods
- Contact billing support