Containers Overview
Deploy, scale, and manage Docker containers with ease.
Containers are the core building blocks of your applications on SailOps. Each container runs a Docker image and can be scaled, configured, and monitored independently.
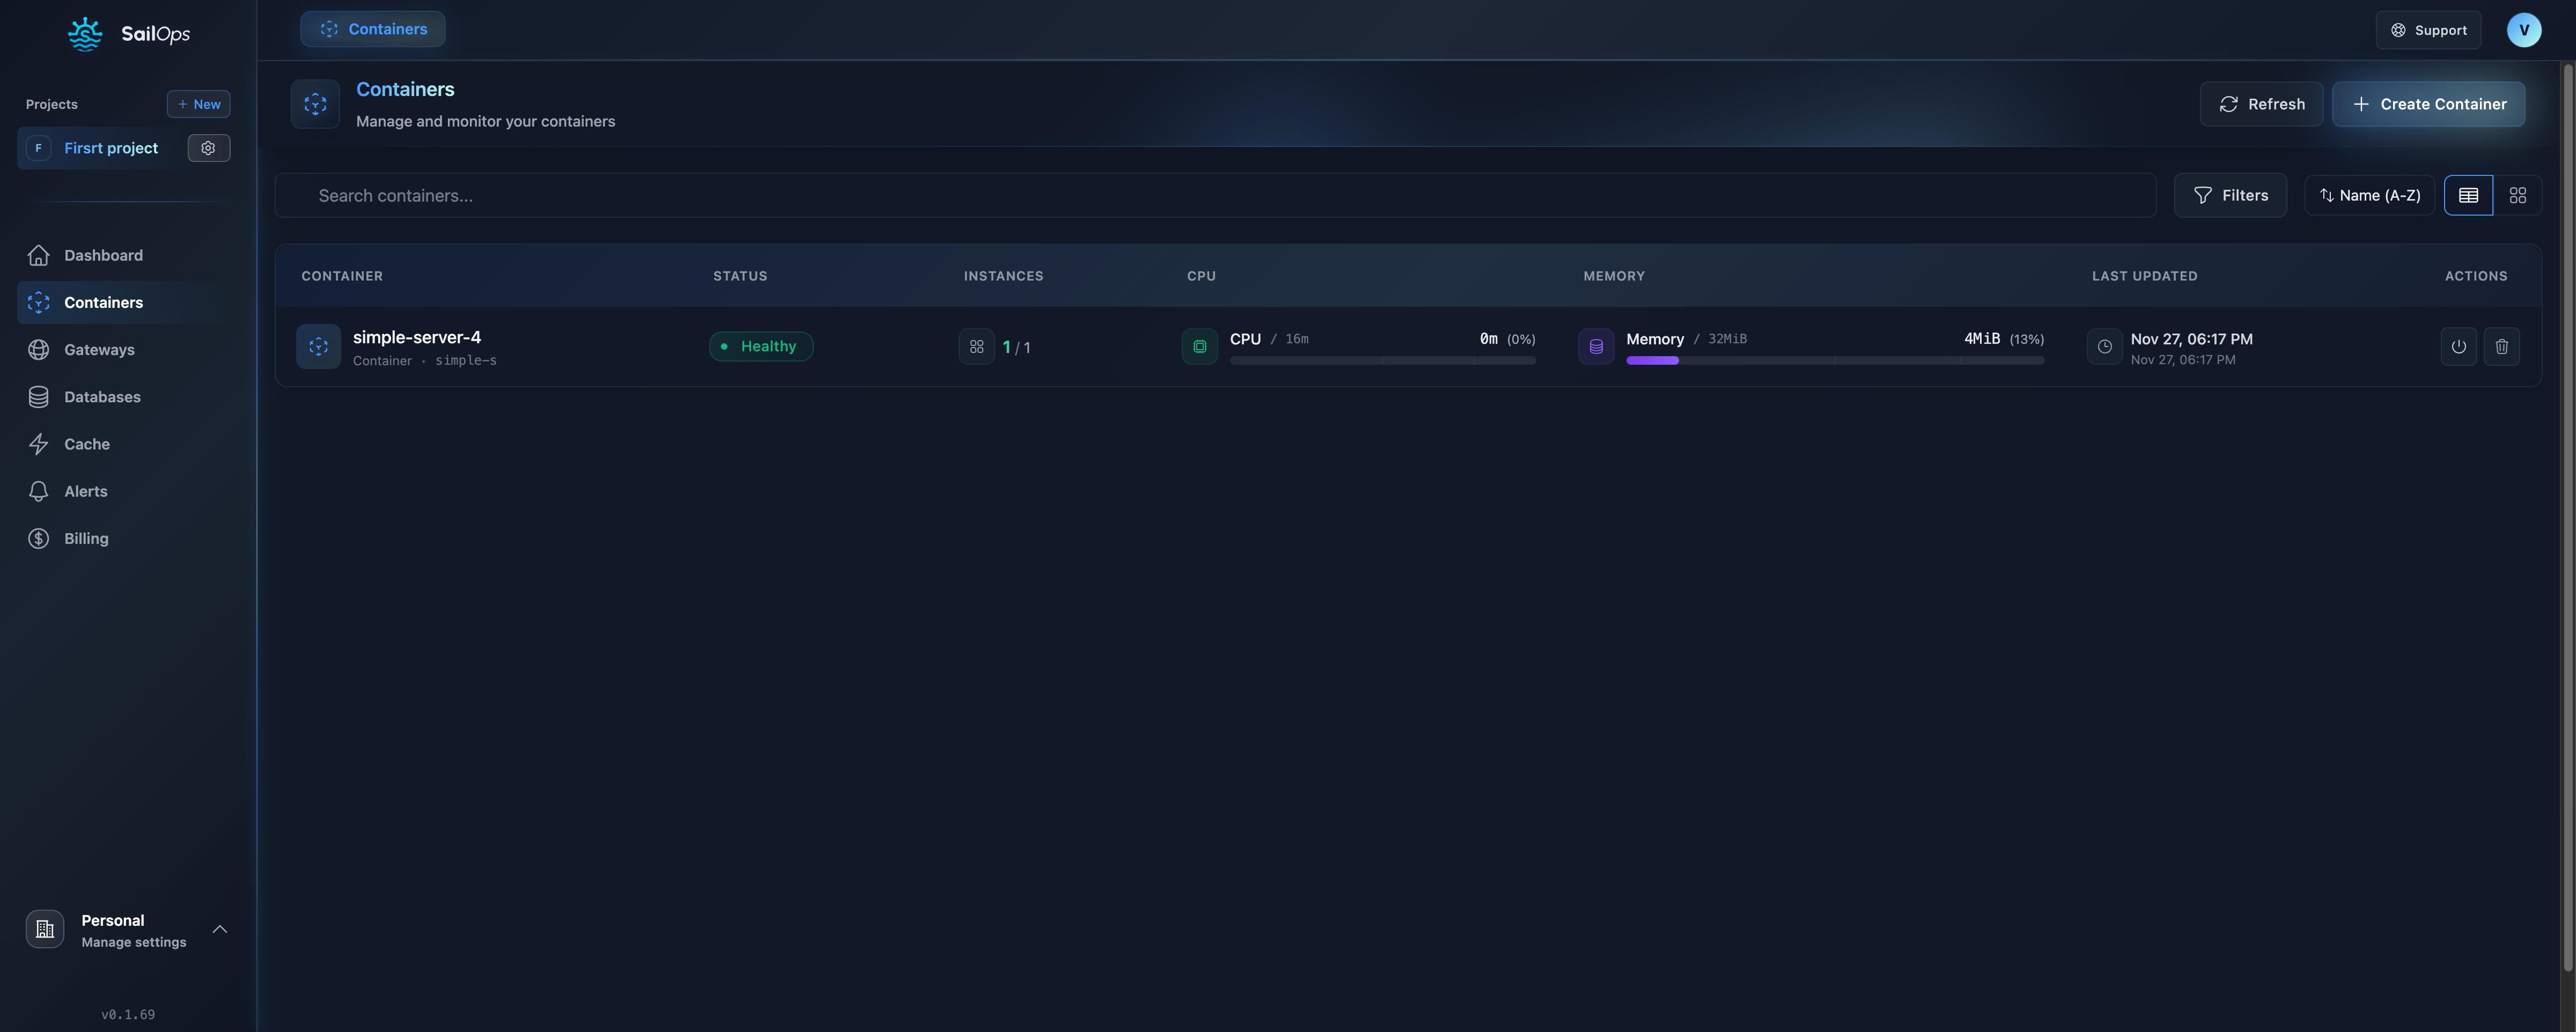
What is a Container?
A Container in SailOps is a running instance of your Docker image. It includes:
- Compute resources (CPU and memory)
- Network connectivity (internal and external)
- Storage (ephemeral or persistent)
- Environment configuration (variables and secrets)
Key Features
Instant Deployment
Deploy containers in seconds from any Docker registry:
- Docker Hub
- GitHub Container Registry (ghcr.io)
- GitLab Container Registry
- Private registries
Automatic Scaling
Scale from 0 to 100+ replicas automatically based on:
- CPU utilization
- Memory usage
- Cron schedules (scheduled scaling)
Persistent Volumes
Attach durable storage to your containers:
- Data persists across restarts and redeployments
- Configurable mount path and size (up to 100 GB)
- Automatic volume lifecycle management
- Volume Snapshots — create point-in-time backups, schedule automated snapshots, and restore volumes
Zero-Downtime Updates
Update your containers without interruption:
- Rolling deployments (stateless containers)
- Health check verification
- Automatic rollback on failure
- Live rollout progress — a progress banner shows updated vs. total replicas, target image, and a progress bar during rolling updates
- Elapsed timer — displays how long a container has been in a transitional state (Pending or Updating)
Init Containers
Init containers run sequentially before the main container starts. Use them for database migrations, configuration generation, or dependency checks.
| Field | Required | Description |
|---|---|---|
image | Yes | Container image to run |
name | No | DNS-1123 name (auto-generated if omitted) |
command | No | Command line to execute |
Up to 10 init containers can be configured per container. They replace the legacy initImage/initCommand fields which are now deprecated.
Built-in Monitoring
Get visibility into your containers:
- Real-time CPU and memory metrics
- Container logs with filtering
- Interactive terminal for live debugging
- Event history
- Health status
- Workload diagnostics
Container States
| State | Description |
|---|---|
| Pending | Container is provisioning compute capacity — the platform is selecting a server for your instances |
| Healthy | Container is running normally and serving traffic |
| Updating | Container is being updated via rolling deployment — existing instances continue serving traffic. A progress banner displays real-time rollout status. |
| Warning | Container is running but experiencing issues (e.g. restarts) |
| Error | Container has encountered a critical error |
| Stopped | Container has been manually stopped or is newly created |
| Unknown | Container state cannot be determined |
Containers are created in stopped state with 0 replicas. Click Start when you are ready to deploy.
Workload diagnostics
When a container fails to start or encounters a runtime failure, the Overview tab displays a diagnostic card with:
- A summary of the problem (e.g. "Memory limit exceeded", "Readiness probe failed", "Process exited with code 127")
- Suggestions — actionable steps to resolve the issue, including probe configuration details and exit code explanations
- Technical details — sanitized runtime evidence (credentials and sensitive data are automatically redacted)
- Source — where the diagnostic originated (application container, init container, instance, runtime event, or workload)
- Context badges showing the container name, instance name, and user ID when relevant
- A View logs button linking directly to the logs of the affected instance
When the application process has not started yet, the card indicates that no application logs are available.
When an active diagnostic is present, the container header shows Deployment needs attention and the health banner displays Needs attention with the number of ready instances, replacing the normal rollout progress indicator.
After the container recovers, the last diagnostic stays visible as a Previous failure with its resolution timestamp, so you can review what happened even after the issue is fixed.
Diagnostics cover startup issues, health check probe failures (readiness, liveness, startup), out-of-memory kills, and generic process terminations with exit code guidance. They refresh automatically on every status change. No configuration is needed.
Compute Classes
Choose the right compute class for your workload. Each class has a fixed CPU:RAM ratio, and you can scale resources using sliders within the class limits.
| Class | CPU:RAM Ratio | Max CPU | Max RAM | Best For |
|---|---|---|---|---|
| Eco | 1:2 | 3 cores | 6 GB | Development, testing, budget-conscious workloads |
| Standard | 1:4 | 15 cores | 58 GB | General production workloads |
| Production | 1:4 | 6 cores | 28 GB | Sensitive workloads requiring dedicated resources |
| Prod. Compute | 1:2 | 6 cores | 16 GB | CPU-intensive tasks (data processing, APIs) |
| Prod. Memory | 1:8 | 6 cores | 58 GB | Memory-intensive tasks (caching, ML inference) |
| ARM | 1:4 | 8 cores | 32 GB | Cost-optimized ARM-based workloads |
| Spot | 1:4 | — | — | Preemptible capacity at reduced cost |
Containers running on the Spot compute class can automatically fall back to Eco when Spot capacity is exhausted. This behavior is enabled by default (spotFallbackEnabled: true) and can be disabled per container via the API or dashboard if you prefer the container to wait for Spot capacity instead.
How Resource Allocation Works
Within each compute class, you configure resources using sliders:
- CPU: Adjust in increments (varies by class)
- Memory: Automatically calculated based on CPU:RAM ratio
Example with standard class (1:4 ratio):
- 1 vCPU → 4 GB RAM
- 2 vCPU → 8 GB RAM
- 4 vCPU → 16 GB RAM
- Start with Eco for development and testing
- Use Standard for most production workloads
- Choose Production when you need dedicated performance guarantees
- Select Prod. Compute or Prod. Memory for specialized workloads
- Consider ARM for cost savings on compatible applications
Container Networking
Internal Networking
Containers within the same project can communicate using internal DNS:
http://{service-name}.{project-name}:{port}
Or the short form within the same project:
http://{service-name}:{port}
Example: A container named api in project my-project can be reached at:
http://api.my-project:8080(full form)http://api:8080(short form, from same project)
External Access
Expose containers to the internet via Gateways:
- Create a gateway
- Add a route pointing to your container
- Access via HTTPS
Quick Expose
For rapid testing or simple deployments, use the Quick Expose feature to instantly expose your container via a shared gateway with a single click. This creates a public URL without requiring you to set up a dedicated gateway.
Quick Expose is ideal for development and demos. For production workloads, set up a dedicated gateway with your own custom domain.
Container Detail Pages
When viewing a container, the detail view provides a contextual navigation sidebar that groups pages by purpose:
| Group | Page | Description |
|---|---|---|
| Summary | Overview | Status, replicas, resource usage, quick actions (start/stop/restart), rollout progress banner during updates, workload diagnostics |
| Summary | Instances | Running instances with image tag and version indicators during rollouts |
| Configure | General | Container spec, network configuration, autoscaling, persistent volume |
| Configure | Environments | Environment variables management |
| Configure | Connections | Database, cache, and NATS service connections |
| Configure | Volumes | Persistent volume configuration and volume snapshots |
| Operate | Logs | Real-time container logs |
| Operate | Terminal | Interactive shell (bash/sh) into a running instance |
| Observe | Metrics | Real-time metrics (CPU, memory, network) |
| Observe | Events | Kubernetes events for the container |
| Observe | Alerts | Alerts related to this container |
| Govern | Security | Security context (run-as user/group, read-only filesystem) |
| Govern | Activity | Audit log of actions performed on the container |
| Govern | Billing | Container billing and cost details |
Container Lifecycle
Quick Actions
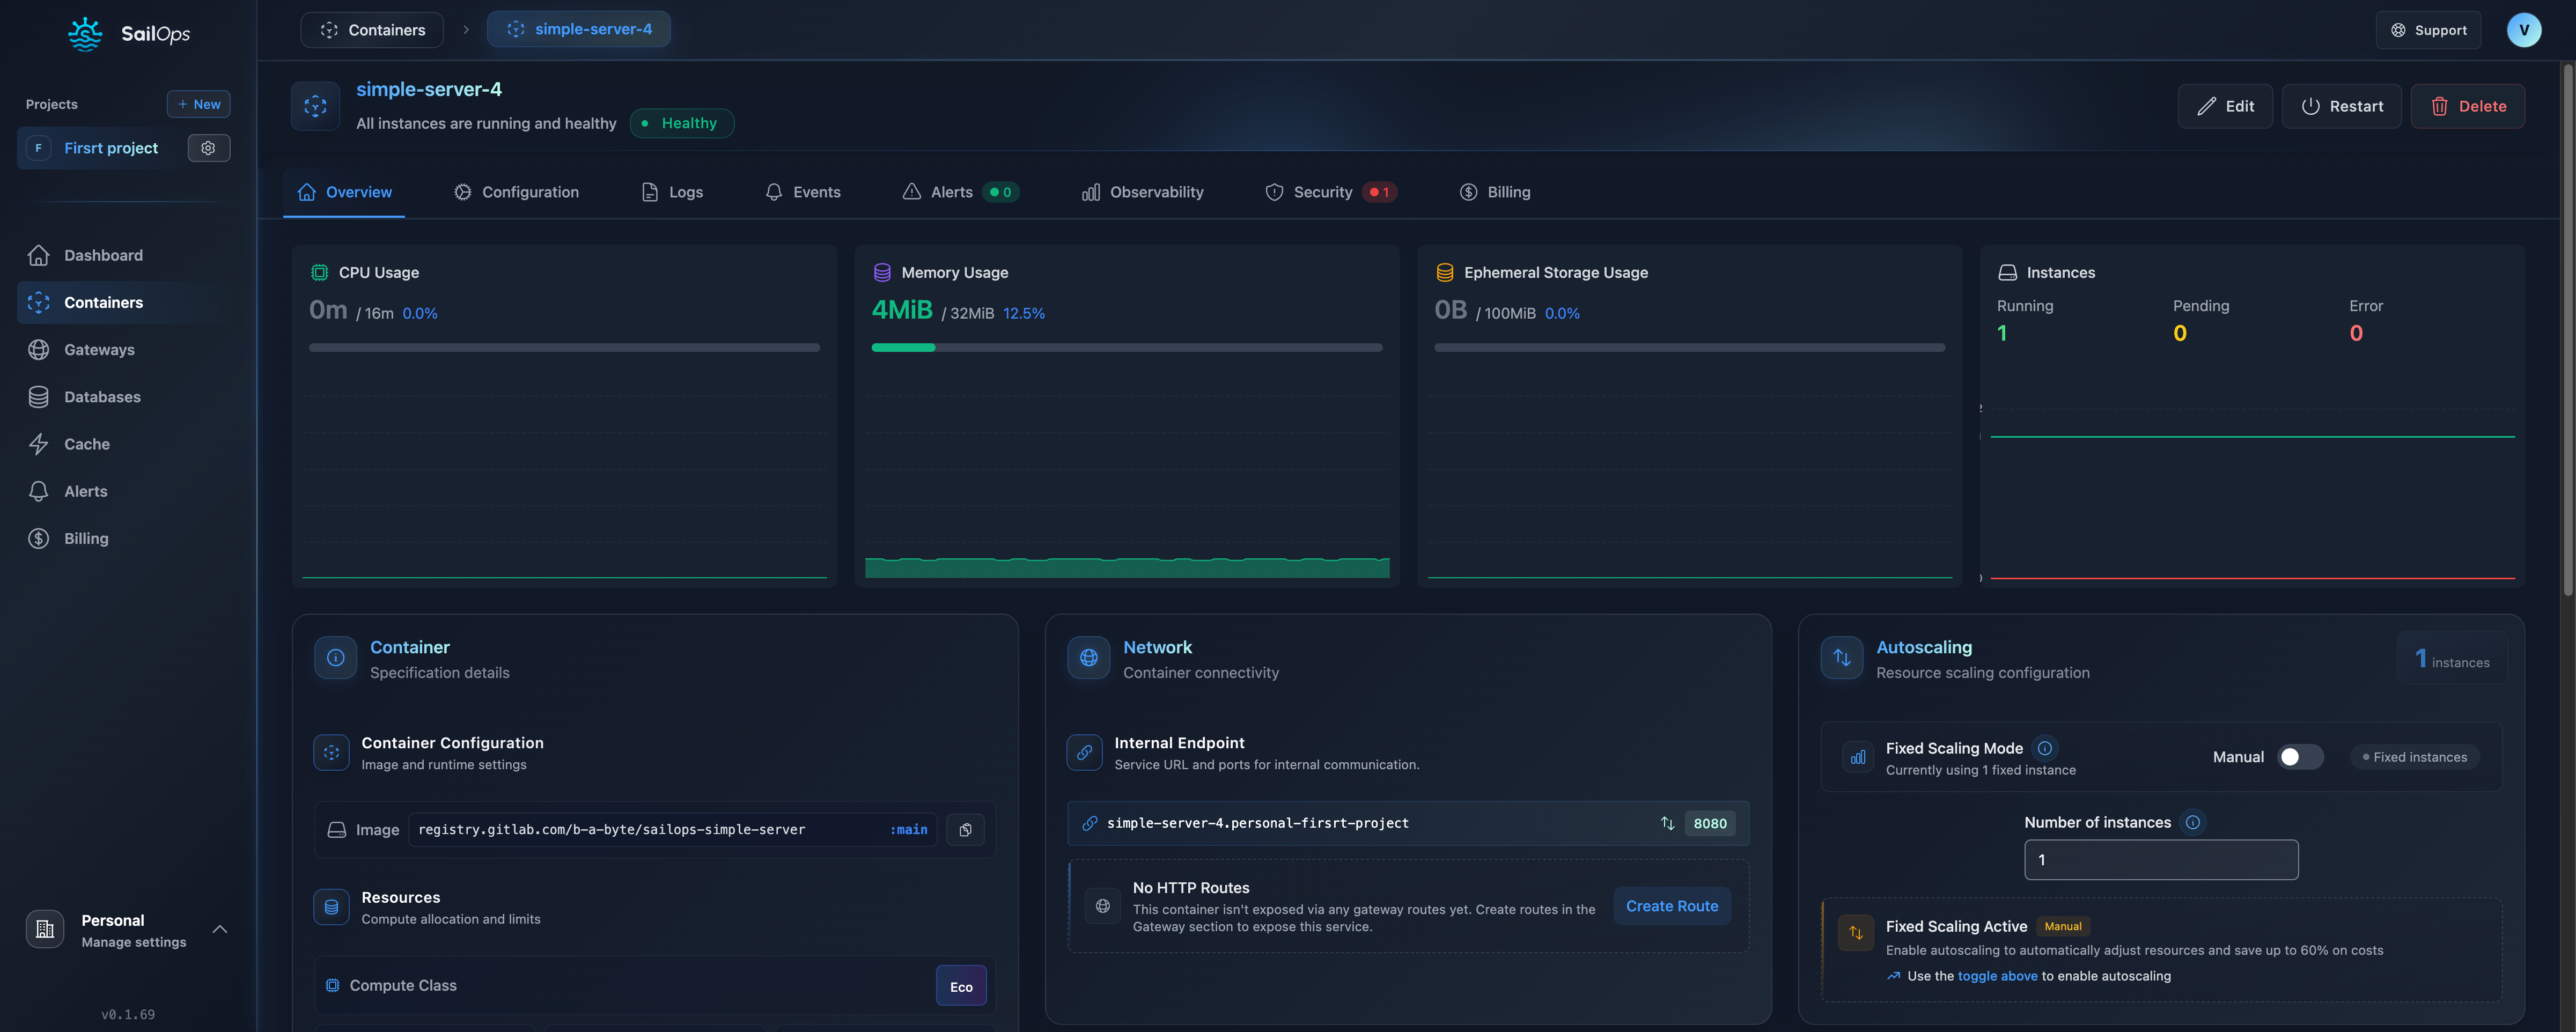
Create a Container
- Navigate to Containers
- Click Create Container
- Choose Simple or Advanced mode for the creation form
- Fill in the configuration
- Click Create
- Start the container when ready
The creation form offers a Simple mode for quick setup with sensible defaults, and an Advanced mode for full control over compute class, health checks, security context, and more.
Update a Container
- Go to your container
- Click Edit
- Change the image or configuration
- Click Save
Scale a Container
- Go to your container
- Click Scale
- Set min/max replicas
- Configure scaling triggers
Best Practices
Health Checks
Always configure health checks for production containers:
# Example: HTTP health check
Path: /health
Port: 8080
Interval: 30s
Timeout: 5s
Resource Limits
Set appropriate resource limits to prevent runaway processes from affecting other containers.
Graceful Shutdown
Ensure your application handles SIGTERM for graceful shutdowns during updates and scaling.
Stateless Design
Design containers to be stateless when possible. Use databases and cache for structured data. For file-based persistence (SQLite, uploads, caches), use Persistent Volumes.