Logs and Events
View real-time logs and track container lifecycle events.
Container Logs
Access application logs from your containers in real-time.
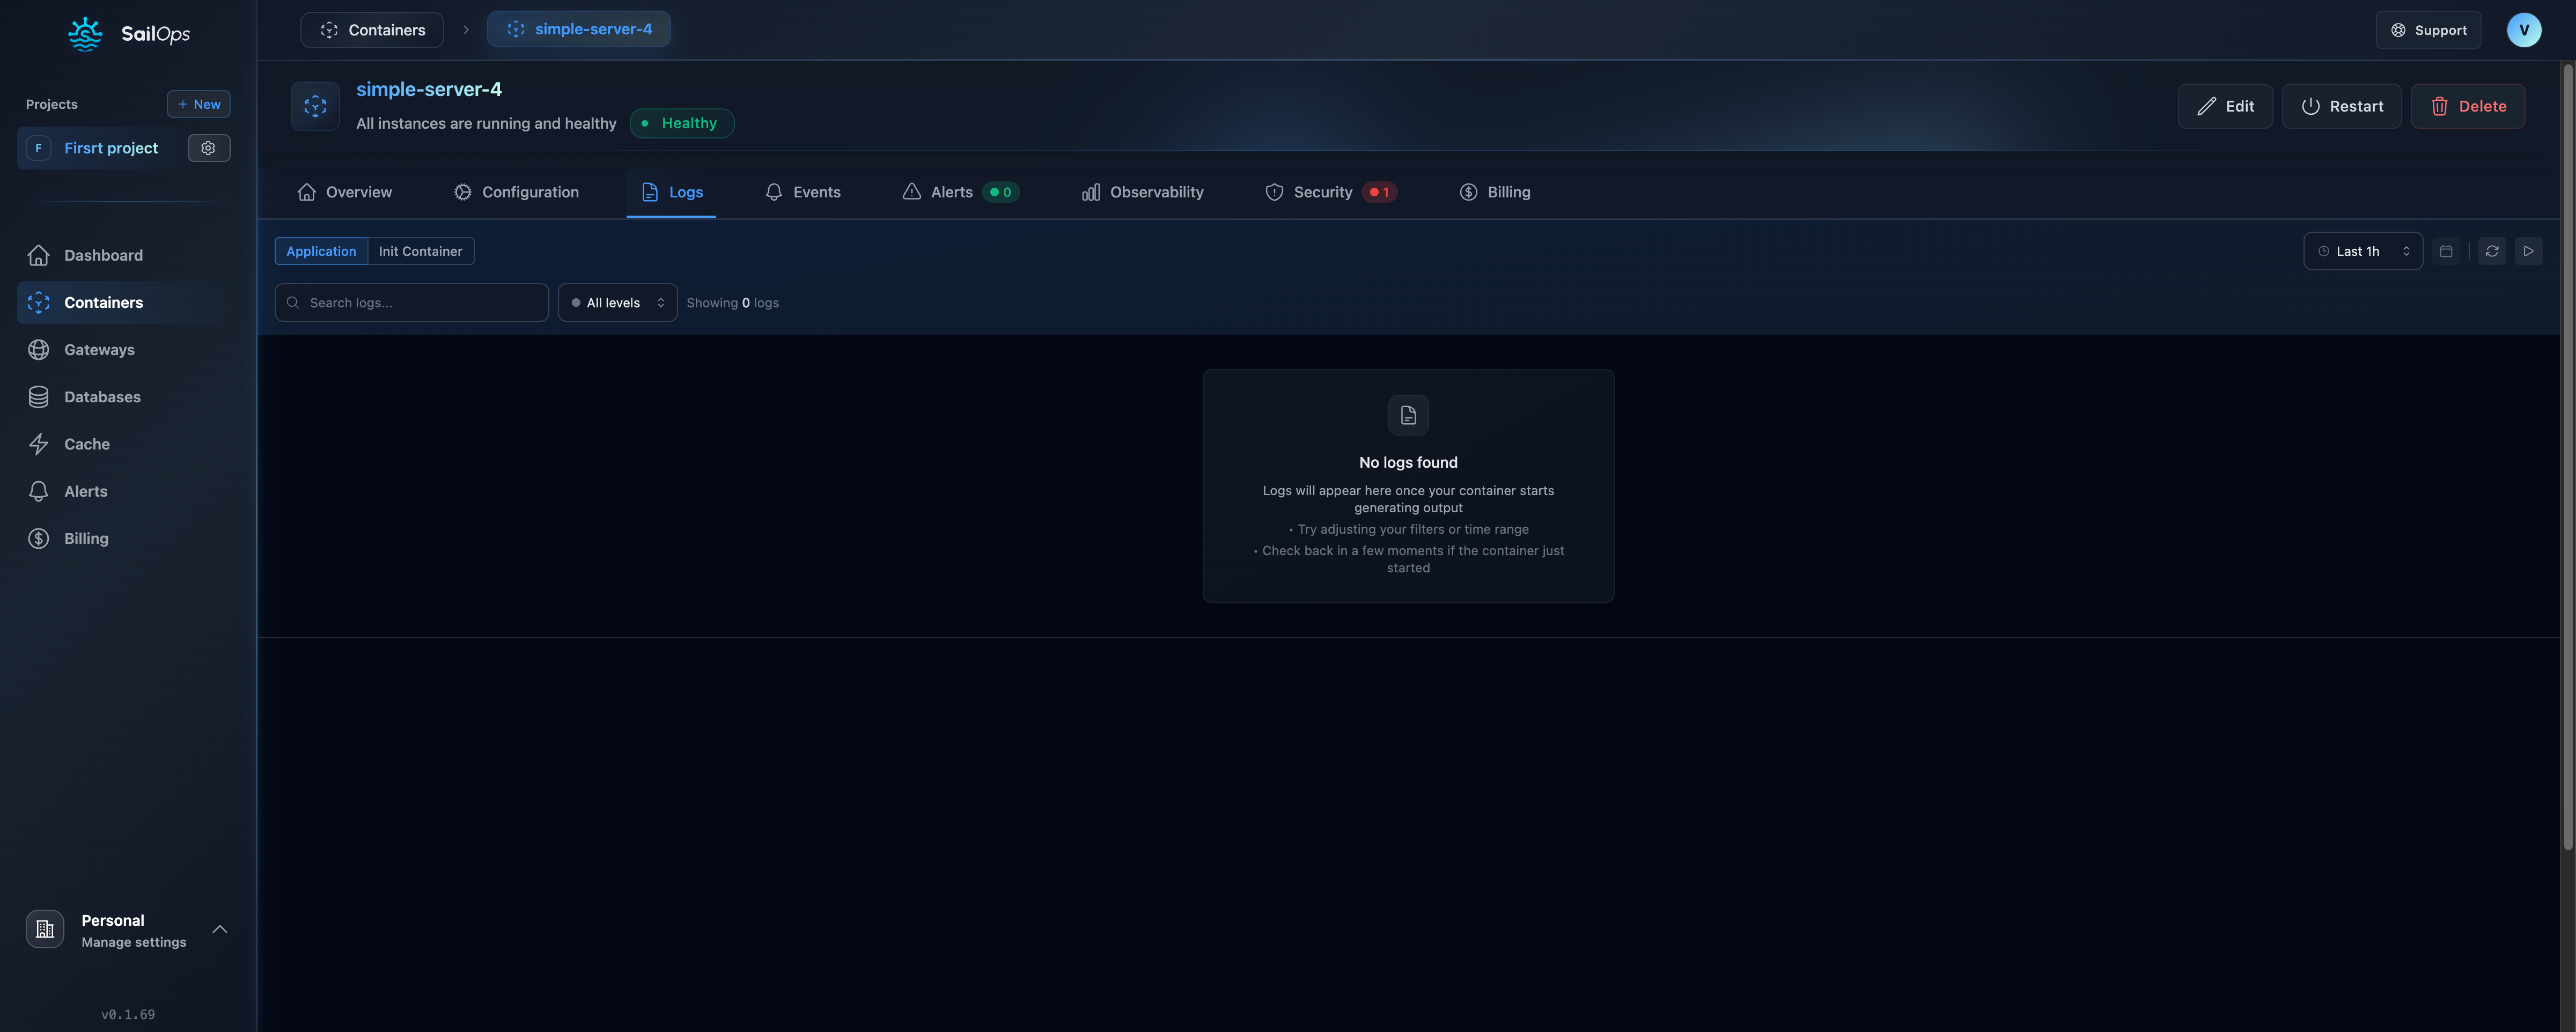
Viewing Logs
- Navigate to your container
- Click the Logs tab
- View real-time log output
Log Features
| Feature | Description |
|---|---|
| Real-time streaming | Logs appear instantly via Server-Sent Events (SSE) |
| Live mode | Toggle live mode to stream logs as they are produced with sub-second latency. See Live Log Streaming for details. |
| Search | Filter logs by keyword |
| Time range | View logs from specific periods |
| Image tag | Each log entry displays the container image tag that produced it, useful for distinguishing versions during rolling updates |
| Download .txt | Export matching logs as a plain-text file |
Filtering Logs
By Severity
Filter by log level:
- Error - Critical issues
- Warning - Potential problems
- Info - Informational messages
- Debug - Detailed debugging
By Time
Select a time range:
- Last 15 minutes
- Last hour
- Last 24 hours
- Custom range
By Keyword
Search for specific terms:
Error: database connection
Log Format
Logs include metadata:
2024-01-15 14:23:45 | INFO  | Request received GET /api/users
2024-01-15 14:23:45 | INFO  | Response sent 200 in 42ms
2024-01-15 14:23:46 | ERROR | Database query failed: connection timeout
Best Practices for Logging
Structured Logging
Use JSON format for easier searching:
{
  "level": "info",
  "message": "User logged in",
  "userId": "user123",
  "timestamp": "2024-01-15T14:23:45Z"
}
Log Levels
Use appropriate levels:
| Level | Use For |
|---|---|
| ERROR | Failures requiring attention |
| WARN | Potential issues |
| INFO | Normal operations |
| DEBUG | Development details |
Avoid Sensitive Data
Never log:
- Passwords
- API keys
- Personal information
- Credit card numbers
Container Events
Events track the lifecycle and health of your containers.
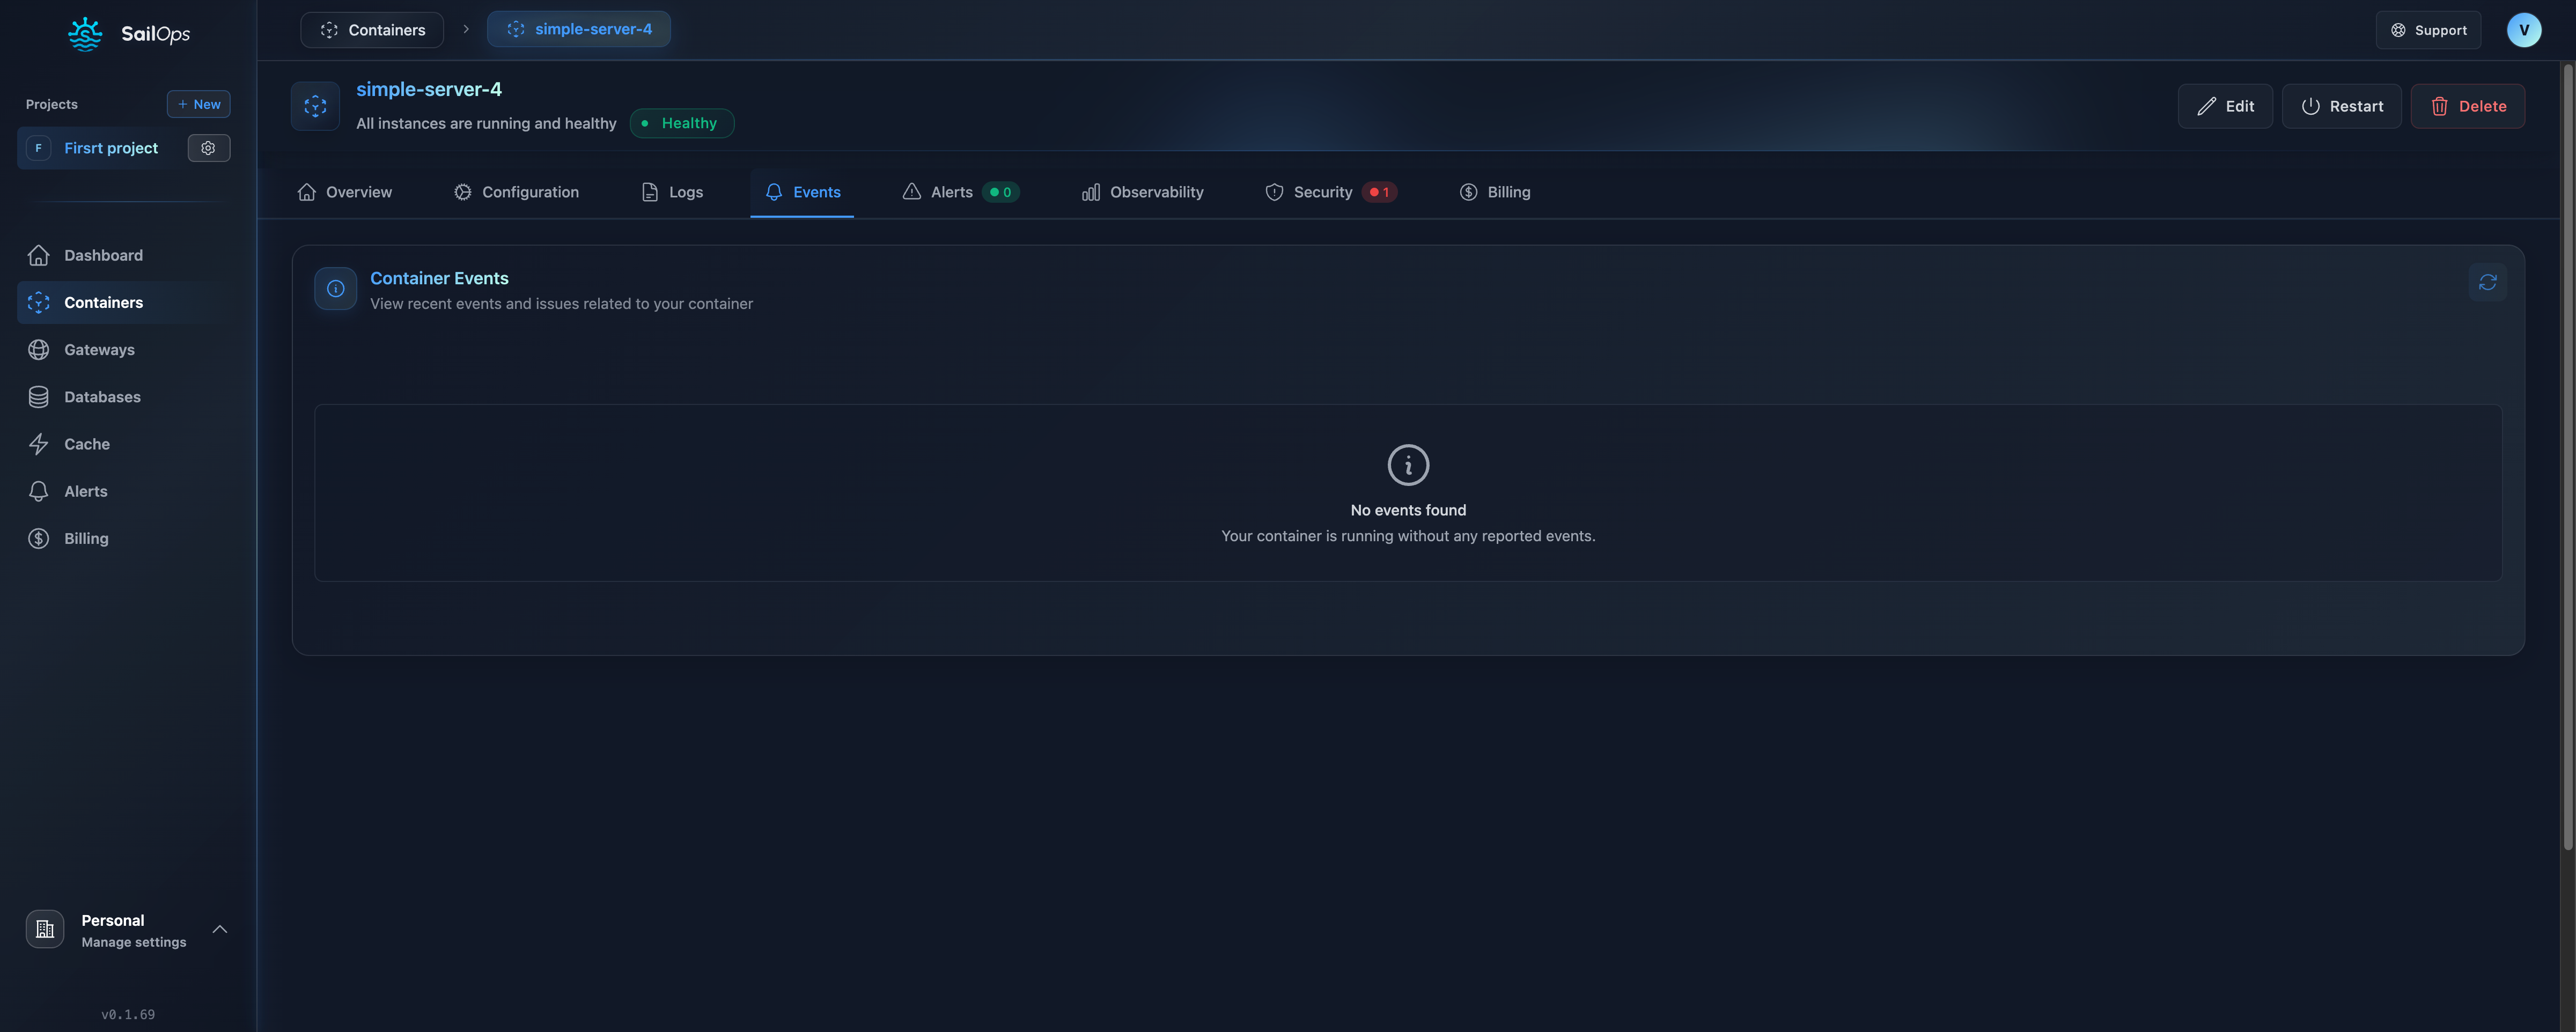
Viewing Events
- Go to your container
- Click the Events tab
- View chronological event history
Event Types
Deployment Events
| Event | Description |
|---|---|
| Created | Container was created |
| Started | Container started running |
| Stopped | Container was stopped |
| Updated | Configuration was changed |
| Deleted | Container was removed |
Health Events
| Event | Description |
|---|---|
| HealthCheckPassed | Health check succeeded |
| HealthCheckFailed | Health check failed |
| Restarted | Container was restarted |
| OOMKilled | Out of memory |
| CrashLoopBackOff | Repeated crashes |
Scaling Events
| Event | Description |
|---|---|
| ScaledUp | Replicas increased |
| ScaledDown | Replicas decreased |
| PodScheduled | New replica scheduled |
Image Events
| Event | Description |
|---|---|
| ImagePulling | Downloading image |
| ImagePulled | Image downloaded |
| ImagePullFailed | Failed to download |
Event Details
Click an event for more information:
- Timestamp - When it occurred
- Reason - Why it happened
- Message - Detailed description
- Source - Component that generated it
Interactive Terminal
Access a live shell session on any running container instance directly from the SailOps dashboard.
Opening a terminal
- Navigate to your container
- Click the Terminal tab
- A shell session (bash if available, otherwise sh) opens automatically on a running instance
Targeting a specific instance
When a container has multiple replicas, you can open a terminal on a specific instance:
- Go to the Details tab
- In the Instances list, click the Terminal shortcut next to the desired instance
Requirements
| Requirement | Details |
|---|---|
| Role | DEVELOPER or higher |
| Container state | At least one Running instance required |
| Idle timeout | Sessions close after 15 minutes of inactivity |
The terminal auto-selects bash when available and falls back to sh. You can run any command available inside your container image.
Alerts from Logs
Set up alerts based on log patterns:
- Go to Monitoring > Alerts
- Create a new alert
- Set trigger: Log pattern match
- Define the pattern (e.g., "ERROR")
- Configure notification channels
Log Retention
Logs are retained for 7 days by default.
For longer retention, export logs to external storage or contact support for custom retention options.
Debugging with Logs
Common Issues
Application Won't Start
Check for:
- Missing environment variables
- Port binding errors
- Dependency failures
ERROR: Unable to connect to database
Error: ENOENT: no such file or directory
FATAL: password authentication failed
Performance Issues
Look for:
- Slow queries
- Memory warnings
- Timeout errors
WARN: Query took 5000ms
WARN: Memory usage at 95%
ERROR: Request timeout after 30s
Crash Loops
Identify root cause:
- Unhandled exceptions
- Missing dependencies
- Configuration errors
Debug Workflow
- Check Events - Understand what happened
- Review Logs - Find error messages
- Analyze Patterns - Identify recurring issues
- Fix and Deploy - Apply the solution
- Monitor - Verify the fix works
Integration with External Tools
Exporting Logs
Download the logs that match your current filters as a plain-text file:
- Apply the desired filters (time range, instance, keyword, stream)
- Click the Download .txt button in the Logs tab
- The browser downloads a
.txtfile containing up to 100 000 matching log lines
The exported file preserves the timestamp, level, instance, stream, image, and message for each entry.
Log Shipping
For advanced analysis, ship logs to:
- Elasticsearch
- Datadog
- Grafana Loki
- CloudWatch
Contact support for log forwarding configuration.
Troubleshooting
No Logs Appearing
- Container might not be running
- Application might not be logging to stdout/stderr
- Check container status first
Logs Are Truncated
- Very long lines are truncated
- Use structured logging for complex data
- Consider log rotation in your app
Missing Historical Logs
- Logs older than retention period are deleted
- Export important logs before expiry
- Consider external log storage